
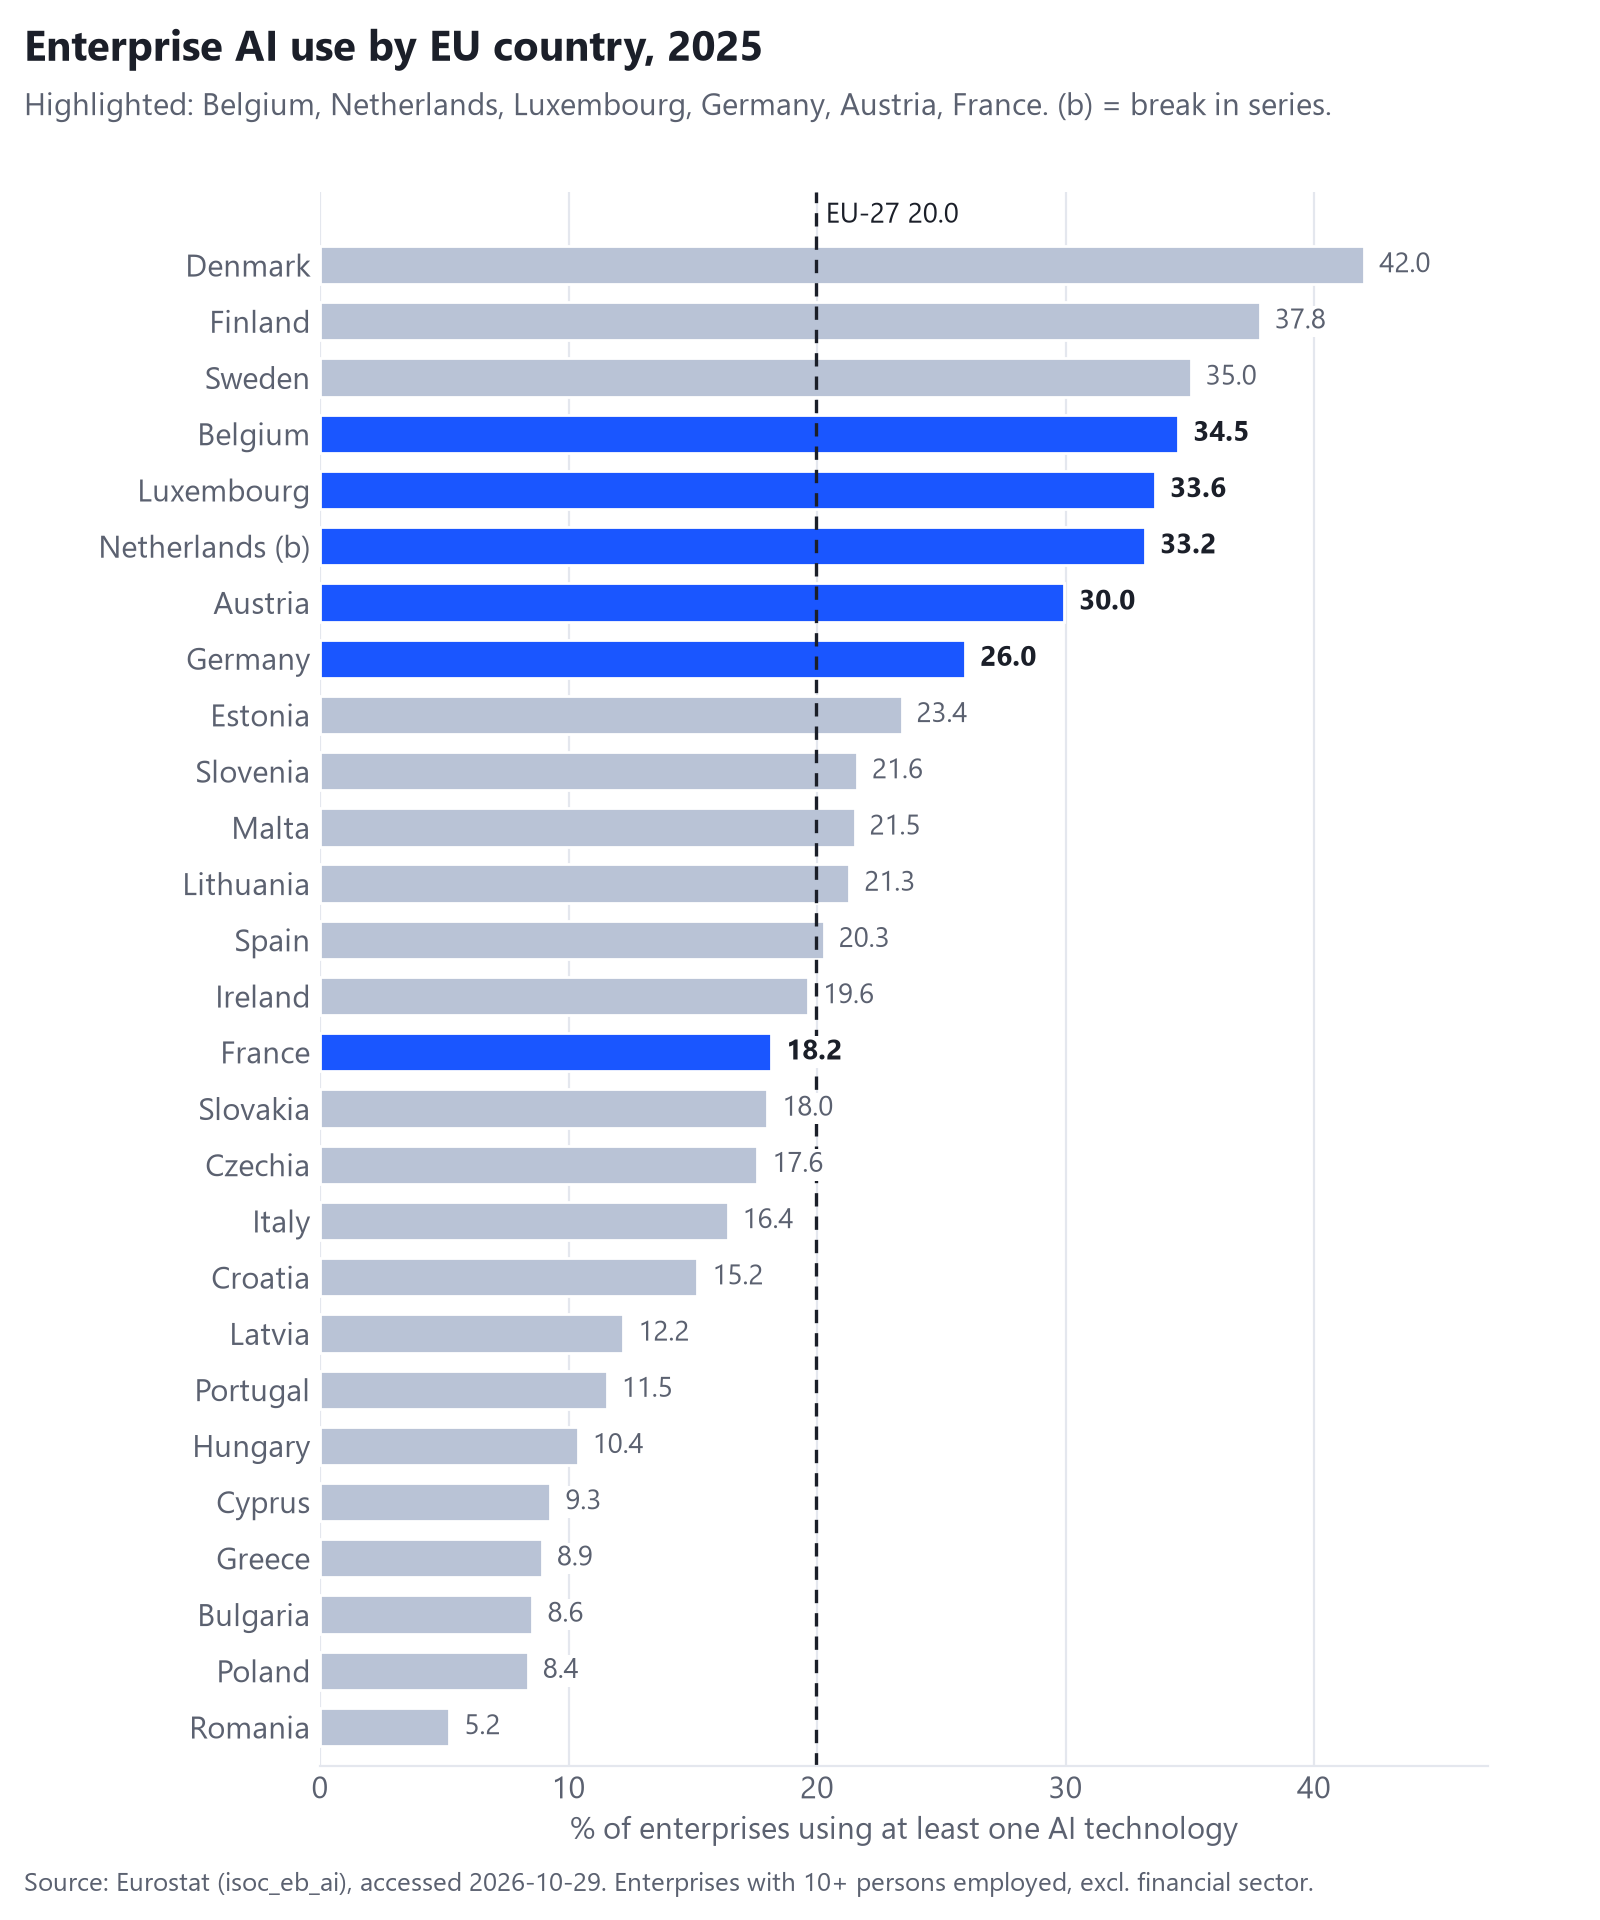
In 2025, 20.0% of EU enterprises with ten or more persons employed used at least one artificial intelligence technology, up from 13.5% in 2024, according to Eurostat. Belgium (34.5%), Luxembourg (33.6%) and the Netherlands (33.2%) are well above that average; Austria reached 30.0%, Germany 26.0% and France 18.2%.
Key takeaways
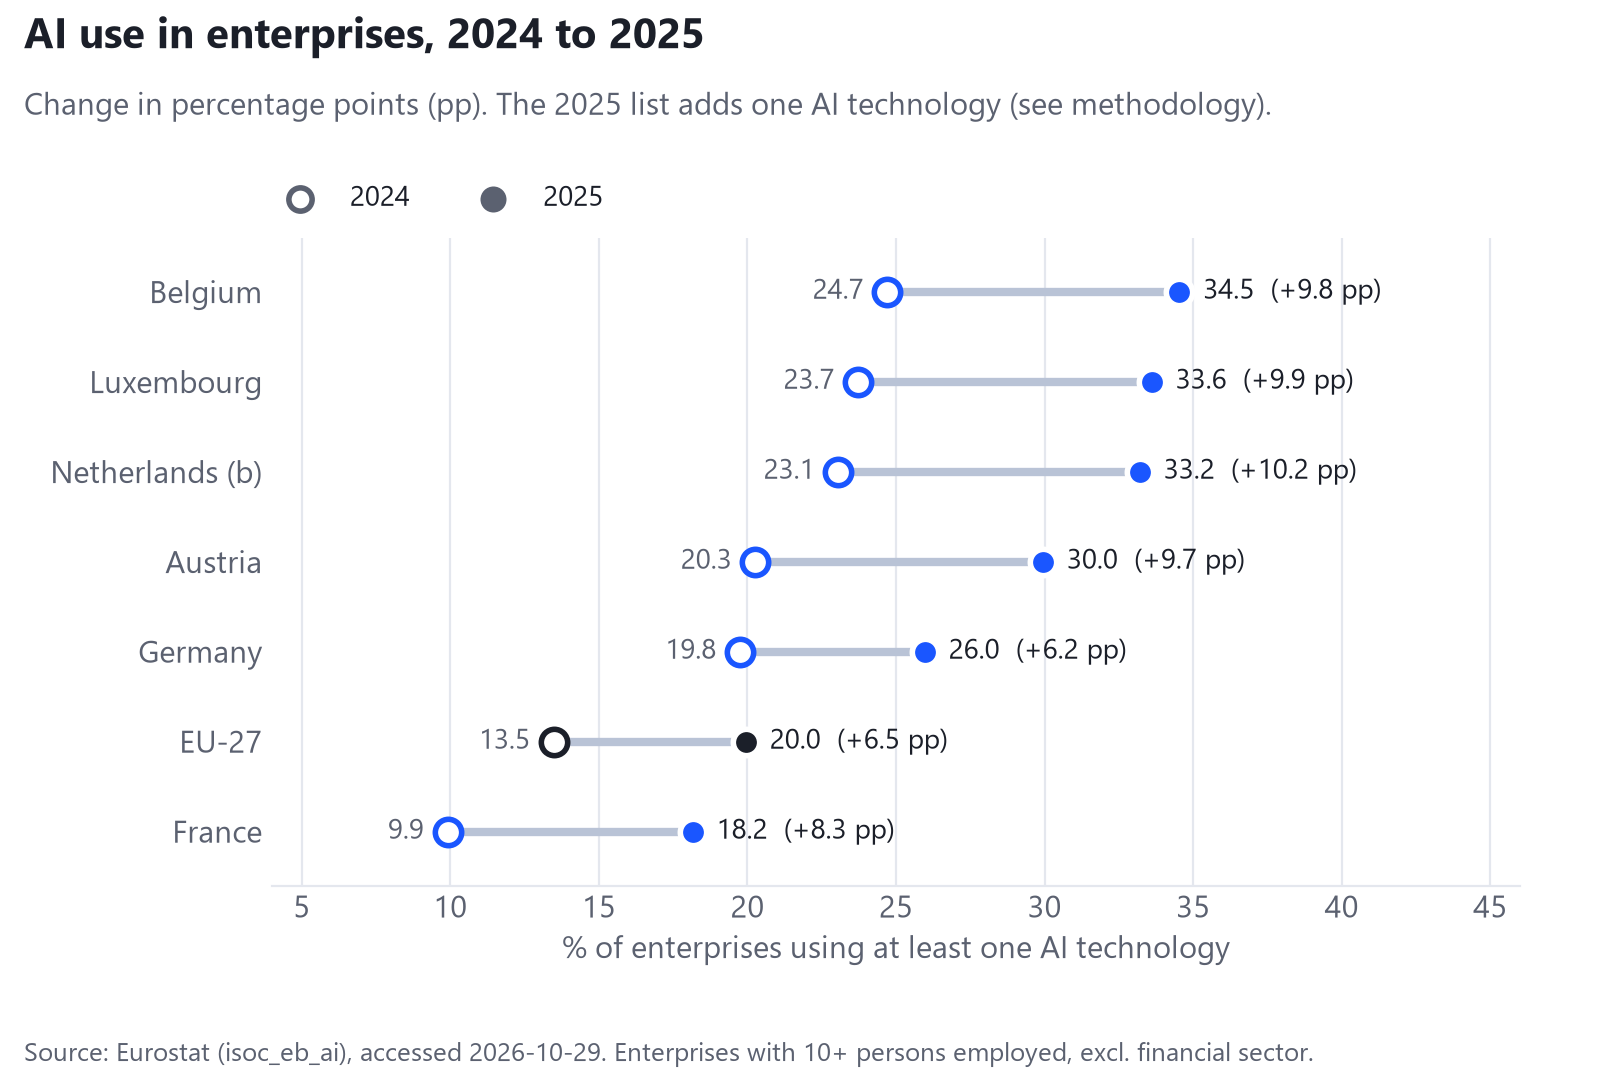
- Across the EU, AI use in enterprises rose by 6.5 percentage points in one year, from 13.5% in 2024 to 20.0% in 2025.
- Belgium ranks 4 of 27 EU countries at 34.5%, behind Denmark, Finland and Sweden; Luxembourg, the Netherlands, Austria and Germany also sit above the EU average, while France (18.2%) sits below it.
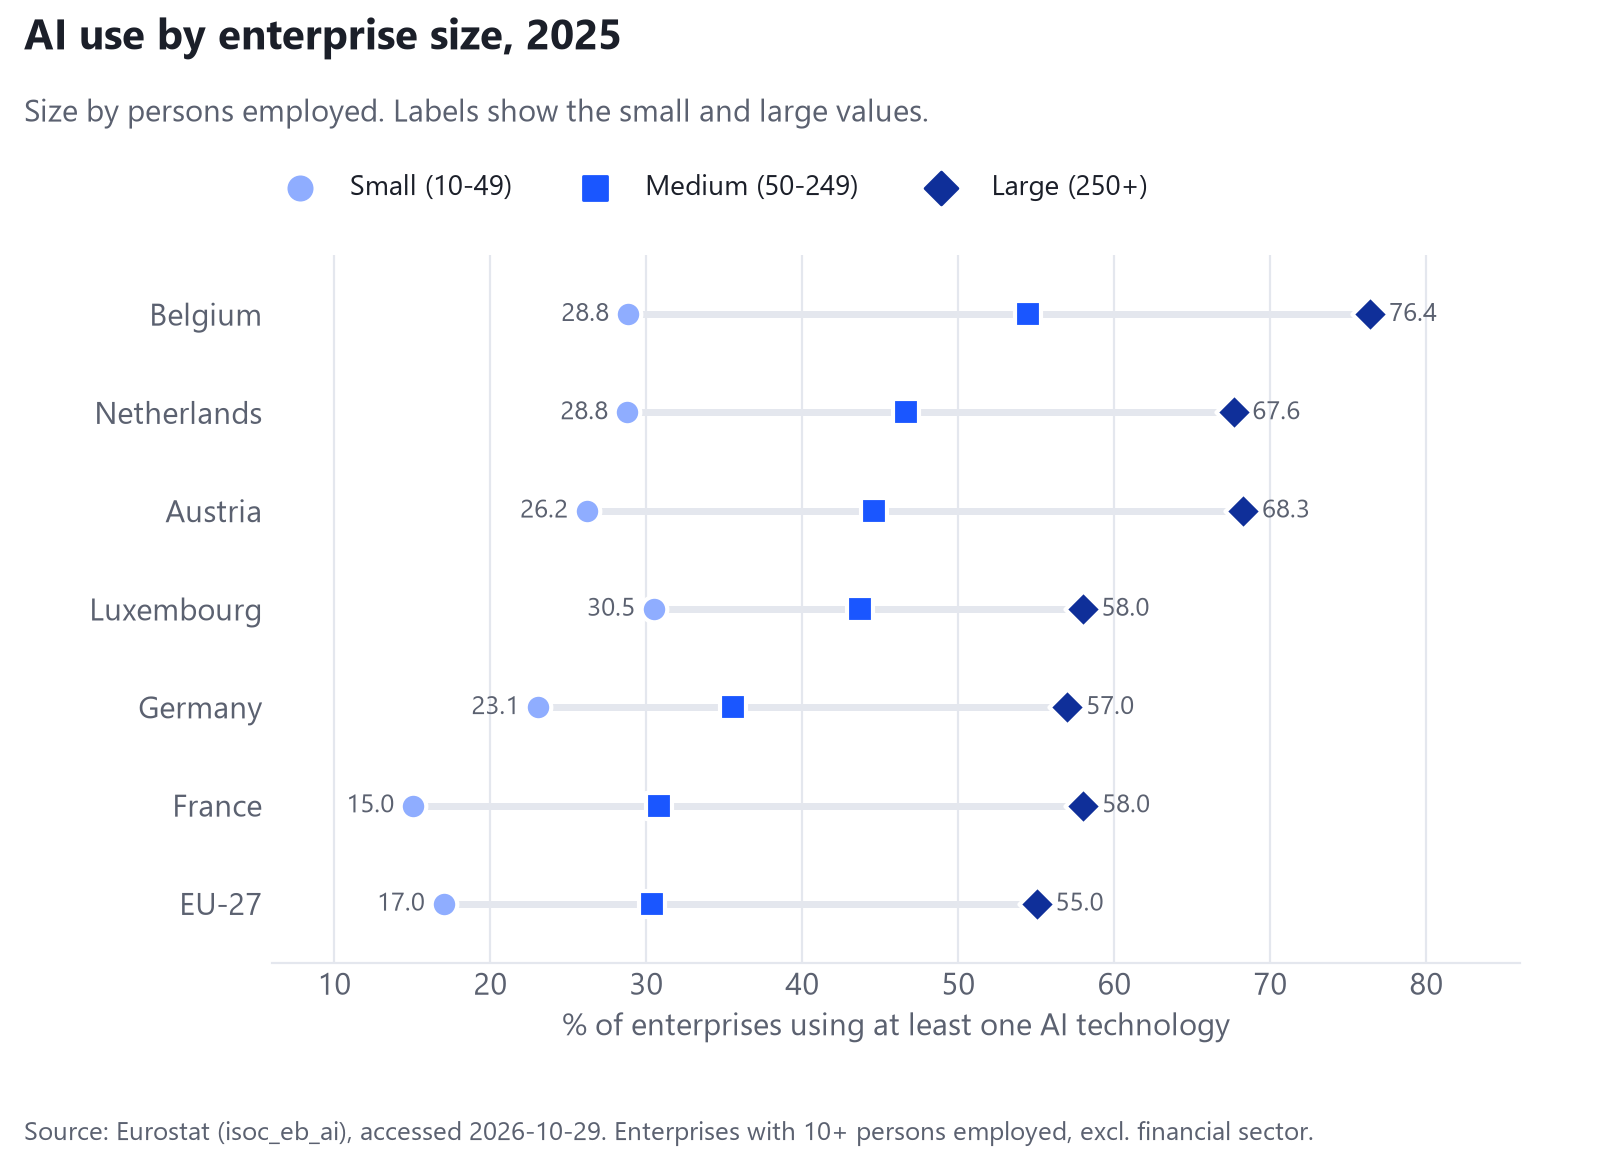
- Size still decides most: 55.0% of large EU enterprises use AI against 17.0% of small ones, a ratio of about 3.2 to one.
- Text mining is the most widely used AI technology in the EU (11.8% of enterprises), followed by generating pictures, video or audio (9.6%) and generating language or code (8.8%).
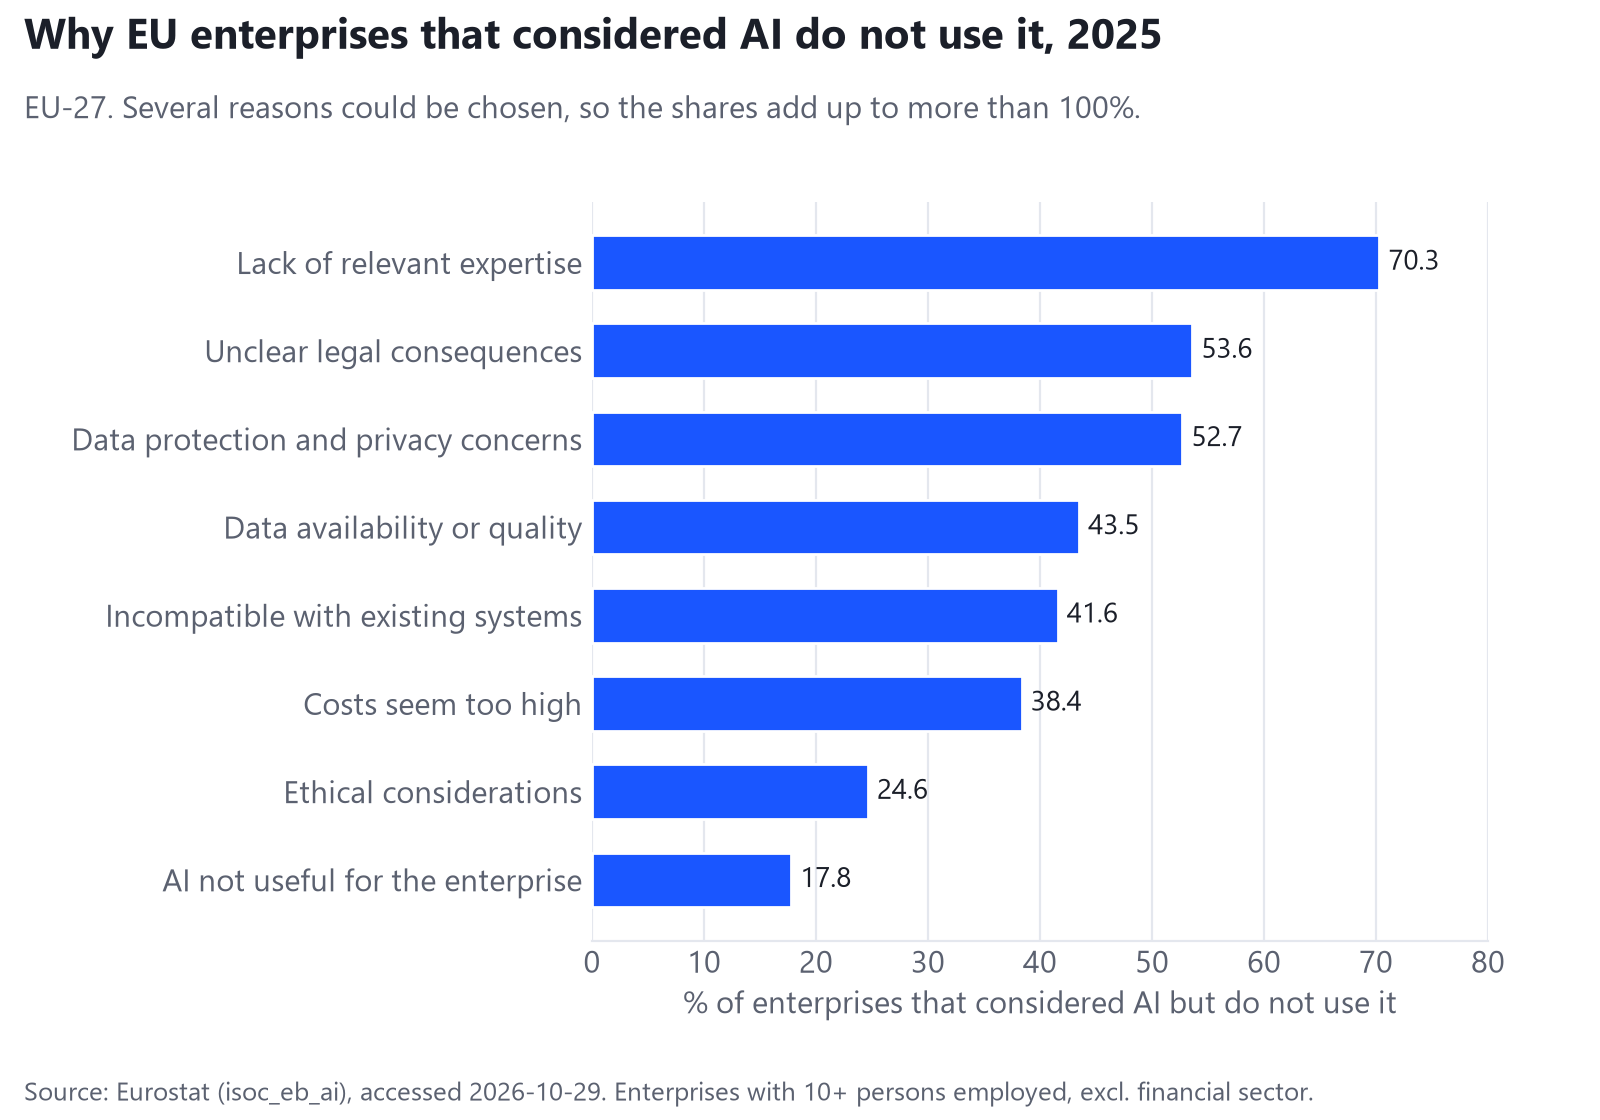
- Among enterprises that considered AI but do not use it, 70.3% cite a lack of relevant expertise, far ahead of cost (38.4%).
How many European enterprises use AI?
One in five. Eurostat's 2025 survey of ICT usage in enterprises found that 20.0% of EU enterprises with ten or more persons employed used at least one AI technology. 13 of the 27 member states are above that figure. The highest shares are in Denmark (42.0%), Finland (37.8%) and Sweden (35.0%).
The six countries covered in detail here split into three groups. Belgium, Luxembourg and the Netherlands form a cluster just below the Nordic leaders, each at around a third of enterprises. Austria and Germany sit between that cluster and the EU average. France is below the EU average, at 18.2%, and ranks 15 of 27.
| Country | 2024 | 2025 | Change (pp) | EU rank, 2025 |
|---|---|---|---|---|
| EU-27 | 13.5 | 20.0 | +6.5 | – |
| Belgium | 24.7 | 34.5 | +9.8 | 4 of 27 |
| Netherlands | 23.1 | 33.2 (b) | +10.2 | 6 of 27 |
| Luxembourg | 23.7 | 33.6 | +9.9 | 5 of 27 |
| Germany | 19.8 | 26.0 | +6.2 | 8 of 27 |
| Austria | 20.3 | 30.0 | +9.7 | 7 of 27 |
| France | 9.9 | 18.2 | +8.3 | 15 of 27 |
(b) = break in time series. pp = percentage points. Source: Eurostat, isoc_eb_ai.
Switzerland does not take part in this Eurostat survey, so it has no comparable figure and is not included.
Which countries grew fastest between 2024 and 2025?
Every country in this group grew faster than or close to the EU as a whole. The EU average rose by 6.5 percentage points. The Netherlands added 10.2 points, Luxembourg 9.9, Belgium 9.8 and Austria 9.7. France added 8.3 points, from 9.9% to 18.2%, and Germany added 6.2.
Rankings moved less than the levels did. Belgium went from rank 3 to 4, Austria from 8 to 7, Germany from 9 to 8 and France from 17 to 15; Luxembourg (5) and the Netherlands (6) held their positions. Two cautions apply to these changes, and both are explained in the methodology section: the 2025 list includes one AI technology that has no 2024 value, and Eurostat flags a break in the time series for the Netherlands in 2025.
How does AI use differ by enterprise size?
Large enterprises are far more likely to use AI than small ones in every country. In the EU, 55.0% of enterprises with 250 or more persons employed use AI, against 30.4% of medium enterprises (50-249) and 17.0% of small enterprises (10-49).
The gap is narrower in Luxembourg, where large enterprises are about 1.9 times as likely to use AI as small ones, and widest in France, at about 3.9 times. Belgium has the highest share for large enterprises in this group (76.4%) and also the largest gap in percentage points (47.6). Small enterprises in Luxembourg (30.5%), Belgium (28.8%) and the Netherlands (28.8%) use AI at close to the rate of medium-sized enterprises across the EU (30.4%).
| Country | Small (10-49) | Medium (50-249) | Large (250+) | Large / small |
|---|---|---|---|---|
| EU-27 | 17.0 | 30.4 | 55.0 | 3.2 |
| Belgium | 28.8 | 54.5 | 76.4 | 2.7 |
| Netherlands | 28.8 (b) | 46.6 | 67.6 | 2.4 |
| Luxembourg | 30.5 | 43.7 | 58.0 | 1.9 |
| Germany | 23.1 | 35.6 | 57.0 | 2.5 |
| Austria | 26.2 | 44.6 | 68.3 | 2.6 |
| France | 15.0 | 30.8 | 58.0 | 3.9 |
Size class by persons employed. (b) = break in time series. Source: Eurostat, isoc_eb_ai.
Small enterprises matter most for the overall figure: Eurostat's survey metadata note that about 83% of the EU's enterprises with ten or more persons employed are small. A national average therefore moves mainly when small firms adopt.
Which AI technologies do enterprises use?
Text mining leads. The analysis of written language is used by 11.8% of EU enterprises. Generating pictures, video or audio, which has its first value in 2025, comes second at 9.6%, and generating written or spoken language or code third at 8.8%. In 2024, text mining stood at 6.9% and generating language or code at 5.4%.
Text mining is the most common technology in five of the six countries, highest in Luxembourg (25.0%) and Belgium (23.0%). In Germany, generating pictures, video or audio (13.5%) is level with text mining (13.5%) at one decimal. Machine learning for data analysis (5.1% in the EU) and AI-based workflow automation (5.4%) are less common, and autonomous robots or vehicles remain rare at 1.4%.
| Technology | EU-27 | Belgium | Netherlands | Luxembourg | Germany | Austria | France |
|---|---|---|---|---|---|---|---|
| Text mining (analysing written language) | 11.8 | 23.0 | 22.9 | 25.0 | 13.5 | 21.9 | 10.2 |
| Generating written or spoken language, or code | 8.8 | 15.9 | 16.3 (b) | 13.9 | 9.0 | 15.3 | 7.8 |
| Generating pictures, video or audio | 9.6 | 17.3 | 14.9 (b) | 14.2 | 13.5 | 13.1 | 7.5 |
| Speech recognition | 7.2 | 12.3 | 11.6 | 13.0 | 10.9 | 9.4 | 6.1 |
| AI-based workflow automation or decision support | 5.4 | 10.8 | 8.5 | 7.4 | 7.0 | 6.4 | 4.5 |
| Machine learning for data analysis | 5.1 | 11.2 | 9.5 | 6.6 | 6.0 | 7.6 | 4.2 |
| Image recognition or processing | 3.8 | 6.5 | 5.2 | 4.4 | 4.3 | 3.2 | 3.7 |
| Autonomous robots, vehicles or drones | 1.4 | 3.0 | 2.4 | 1.7 | 1.5 | 1.6 | 1.7 |
| Two or more of these technologies | 13.0 | 22.9 | 22.5 (b) | 22.2 | 16.2 | 20.5 | 10.7 |
(b) = break in time series. Source: Eurostat, isoc_eb_ai.
What do enterprises use AI for?
Among EU enterprises that use AI, the most common purposes are marketing or sales (34.7%) and business administration or management (31.0%), followed by accounting, controlling or finance (23.1%).
The national mix differs. In Austria, 44.5% of AI-using enterprises apply it to marketing or sales. In Belgium the leading purpose is business administration or management (39.6%), and finance (31.2%) ranks higher than marketing (26.4%). Note that these shares are percentages of enterprises that use AI, not of all enterprises.
| Purpose | EU-27 | Belgium | Netherlands | Luxembourg | Germany | Austria | France |
|---|---|---|---|---|---|---|---|
| Marketing or sales | 34.7 | 26.4 | 37.2 (b) | 17.0 | 35.1 | 44.5 | – |
| Business administration or management | 31.0 | 39.6 | 39.3 | 27.2 | 27.6 | 37.9 | – |
| Accounting, controlling or finance | 23.1 | 31.2 | 22.7 | 17.1 | 27.4 | 22.4 | – |
| Production processes | 20.8 | 17.1 | 20.8 | 13.3 | 21.1 | 25.2 | 20.9 |
| ICT security | 19.8 | 24.9 | 19.9 | 17.6 | 20.6 | 16.7 | 17.4 |
| Research and development or innovation | 19.1 | 22.1 | 25.6 | 16.6 | 12.8 | 17.2 | – |
| Logistics | 6.1 | 6.1 | 6.3 | 3.5 | 4.6 | 4.7 | 6.4 |
– = not published by Eurostat (France: low reliability, value withheld). (b) = break in time series. Source: Eurostat, isoc_eb_ai.
Why do enterprises that considered AI not use it?
Mainly because of skills. Eurostat asks enterprises that do not use AI whether they ever considered it; in the EU, 14.2% of non-users had. Of those, 70.3% name a lack of relevant expertise as a reason. Legal uncertainty (53.6%) and data protection and privacy concerns (52.7%) come next. Costs are cited by 38.4%, and only 17.8% say AI is not useful for their enterprise.
Lack of expertise is the top reason in every country covered here, from 67.9% in Austria to 78.4% in the Netherlands. Legal uncertainty is cited more often in Germany (62.2%) and Belgium (57.9%) than in the Netherlands (37.9%), and costs are cited least in the Netherlands (21.6%). In Belgium the share citing data protection concerns rose from 36.9% in 2024 to 50.9% in 2025.
| Reason | EU-27 | Belgium | Netherlands | Luxembourg | Germany | Austria |
|---|---|---|---|---|---|---|
| Lack of relevant expertise | 70.3 | 74.5 | 78.4 | 78.0 | 72.1 | 67.9 |
| Lack of clarity about legal consequences | 53.6 | 57.9 | 37.9 | 55.5 | 62.2 | 50.1 |
| Data protection and privacy concerns | 52.7 | 50.9 | 47.3 | 54.7 | 60.0 | 50.2 |
| Availability or quality of data | 43.5 | 46.2 | 36.1 | 45.6 | 43.7 | 40.9 |
| Incompatibility with existing systems | 41.6 | 38.3 | 33.7 | 39.3 | 45.4 | 37.0 |
| Costs seem too high | 38.4 | 35.5 | 21.6 | 39.4 | 32.4 | 27.6 |
| Ethical considerations | 24.6 | 27.0 | 20.6 | 33.5 | 22.6 | 27.0 |
| AI is not useful for the enterprise | 17.8 | 14.6 | 12.2 | 17.3 | 18.1 | 22.6 |
More than one reason could be given. France: not published for this indicator. Source: Eurostat, isoc_eb_ai.
How digitally ready are SMEs?
AI tends to build on a digital base. Eurostat's Digital Intensity Index counts how many of a set of digital technologies an enterprise uses. In 2025, 71.4% of EU small and medium-sized enterprises (10-249 persons employed) reached at least a basic level of digital intensity. The Netherlands (88.8%) and Belgium (84.4%) are highest in this group; France (69.4%) is lowest.
| Country | 2025 |
|---|---|
| EU-27 | 71.4 |
| Belgium | 84.4 |
| Netherlands | 88.8 |
| Luxembourg | 76.7 |
| Germany | 73.6 |
| Austria | 73.0 |
| France | 69.4 |
Digital Intensity Index, version 3. Source: Eurostat, isoc_e_dii.
This page reports the 2025 level only. Eurostat publishes a separate methodological note on the comparability of version 3 of the index in 2025, so no change over time is computed here.
Methodology and limitations
All figures come from the EU survey on ICT usage and e-commerce in enterprises, run each year by the national statistical institutes on a common Eurostat model questionnaire. The 2025 round surveyed a sample of about 157,000 out of around 1.53 million EU enterprises with ten or more persons employed. It covers most of the business economy but excludes the financial sector, agriculture, forestry, fishing, and mining and quarrying.
- What "uses AI" means. An enterprise counts as an AI user if it uses at least one of the listed AI technologies: text mining, speech recognition, generating language or code, generating pictures, video or audio, image recognition, machine learning for data analysis, AI-based workflow automation or decision support, and autonomous robots, vehicles or drones. It is a self-reported yes or no per technology, not a measure of how deeply AI is used.
- Comparability between 2024 and 2025. The item on generating pictures, video or audio has values for 2025 and none for 2024 in the dataset. Part of the 2024-2025 increase may come from that wider list, so the change should be read as indicative.
- Flags. Eurostat marks the Netherlands' 2025 headline figure with a break in the time series (b). Values Eurostat withholds or does not publish, such as several French purpose shares and the French reasons for not using AI, are left out rather than estimated.
- Size classes. Small means 10-49 persons employed, medium 50-249 and large 250 or more. Micro-enterprises with fewer than ten persons employed are not part of the headline figures.
- Computations. Changes are differences in percentage points between published values, ranks are positions among the 27 member states, and ratios divide the large-enterprise share by the small-enterprise share. All values are rounded to one decimal after the calculation.
The raw responses, the dataset codes and the access date (29 October 2026) are kept with this article, so every figure can be traced to its Eurostat cell.
What this means for SMEs
The data describe where enterprises stand, not what any single company should do. Still, three patterns are useful for planning.
- Expertise, not cost, is the most cited obstacle. Among enterprises that considered AI and did not adopt it, a lack of relevant expertise is named more than any other reason, and far more often than cost. Training staff, borrowing expertise or starting with ready-to-use tools addresses the obstacle that the data show most often.
- Start where adoption is already common. Text mining is the most widely used technology, and generative uses for text, code, images and audio follow. Tasks built on documents, emails and reports are a practical first area to test, with a person reviewing the output.
- Treat legal and data questions early. Legal uncertainty and data protection concerns are each cited by around half of the enterprises that held back. Checking the data a tool will process, and reading the European Commission's official AI regulatory framework pages, before choosing a tool reduces that uncertainty.
A useful benchmark for a small enterprise is not the national average, which large firms pull upward, but the small-enterprise figure for its own country: 28.8% in Belgium, 28.8% in the Netherlands, 30.5% in Luxembourg, 23.1% in Germany, 26.2% in Austria and 15.0% in France.
Frequently Asked Questions
What share of EU enterprises use AI?
In 2025, 20.0% of EU enterprises with ten or more persons employed used at least one AI technology, according to Eurostat. That is up from 13.5% in 2024. The figure excludes micro-enterprises with fewer than ten persons employed and the financial sector, and it counts an enterprise as an AI user if it uses any of the listed technologies.
Which EU country has the highest share of enterprises using AI?
Denmark, at 42.0% in 2025, followed by Finland (37.8%) and Sweden (35.0%). Belgium is fourth at 34.5%, Luxembourg fifth at 33.6% and the Netherlands sixth at 33.2%. The ranking uses Eurostat's headline indicator for enterprises with ten or more persons employed.
How many Belgian enterprises use AI?
34.5% of Belgian enterprises with ten or more persons employed used at least one AI technology in 2025, up from 24.7% in 2024. The share is 28.8% for small enterprises, 54.5% for medium enterprises and 76.4% for large enterprises. Belgium ranks 4 of the 27 EU member states.
Why do SMEs not use AI?
The reason most often given is a lack of relevant expertise, cited by 70.3% of EU enterprises that considered AI but do not use it. Legal uncertainty (53.6%) and data protection concerns (52.7%) follow. Cost is cited by 38.4%, and fewer than one in five say AI is not useful for them.
Does Eurostat publish AI figures for Switzerland?
No. The survey covers EU member states, Iceland, Norway and candidate countries, so Switzerland has no figure in this dataset. Any comparison with Switzerland would need a different national source with its own method, so it is not included in this summary.
Conclusion
The Eurostat data show AI use in European enterprises rising quickly, with Belgium, Luxembourg and the Netherlands among the higher adopters in the EU and France still below the average. Size remains the strongest divide, and expertise is the obstacle enterprises name most. This summary was compiled by Rui Codex, a software and AI engineering company based in Belgium; teams planning an AI or automation project can send a project request.
Sources
- Artificial intelligence by size class of enterprise (isoc_eb_ai) - Eurostat
- Digital intensity by size class of enterprise (isoc_e_dii) - Eurostat
- ICT usage in enterprises: reference metadata - Eurostat
- Use of artificial intelligence in enterprises (Statistics Explained) - Eurostat
- AI Act: regulatory framework for AI - European Commission
